
Figure 6.
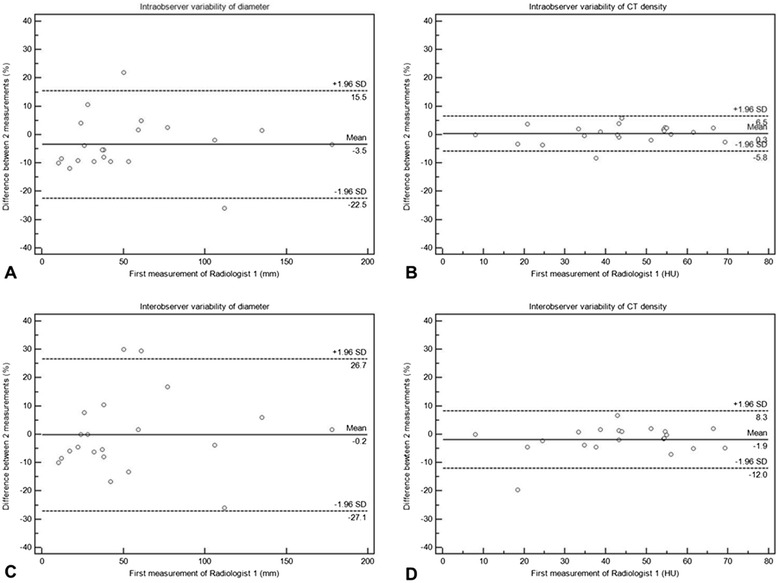
Intra- and inter-observer variability of diameter and density measurements. Bland-Altman plots demonstrate the variability of density and diameter measurements (A, B for intra-observer, C, D for inter-observer, respectively). The relative difference (%) in two independent measurements for each patient is plotted against the first measurement by Radiologist 1. The straight lines represent the mean relative difference (%), and the dotted lines represent the upper and lower 95% limits of agreement (%).