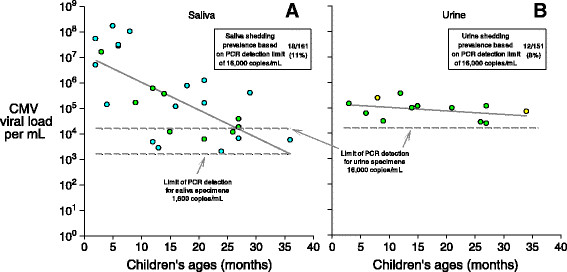
Figure 3.

CMV viral loads per mL as a function of Children's ages in months. Panel A shows results for saliva viral loads and panel B shows results for urine viral loads. Circles are only plotted for children who were shedding; negative results (i.e., viral loads below the limit of detection) are not plotted. Yellow circles represent children shedding CMV in urine only, blue circles represent children shedding in saliva only, and green circles represent children shedding in both urine and saliva. The regression line in Panel A is log10 (CMV viral load) =7.1 - 0.108 (age in months), with r2 = 0.46 and P < 0.001; the regression line in Panel B is log10 (CMV viral load) =5.2 - 0.014 (age in months), with r2 = 0.14 and P = 0.22.
