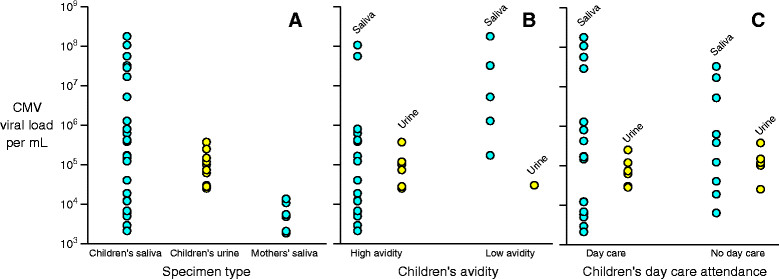
Figure 4.

CMV viral loads per mL stratified by three different variables. Panel A shows viral loads stratified by specimen type (saliva vs. urine) and source (child vs. mother). Panel B shows viral loads for children only stratified by whether the child had high or intermediate versus low CMV IgG antibody avidity. Panel C shows viral loads stratified by day care attendance. Circles are only plotted for children who were shedding; negative results (i.e., viral loads below the limit of detection) are not plotted. Blue circles represent saliva results and yellow circles represent urine results.
