
Figure 1.
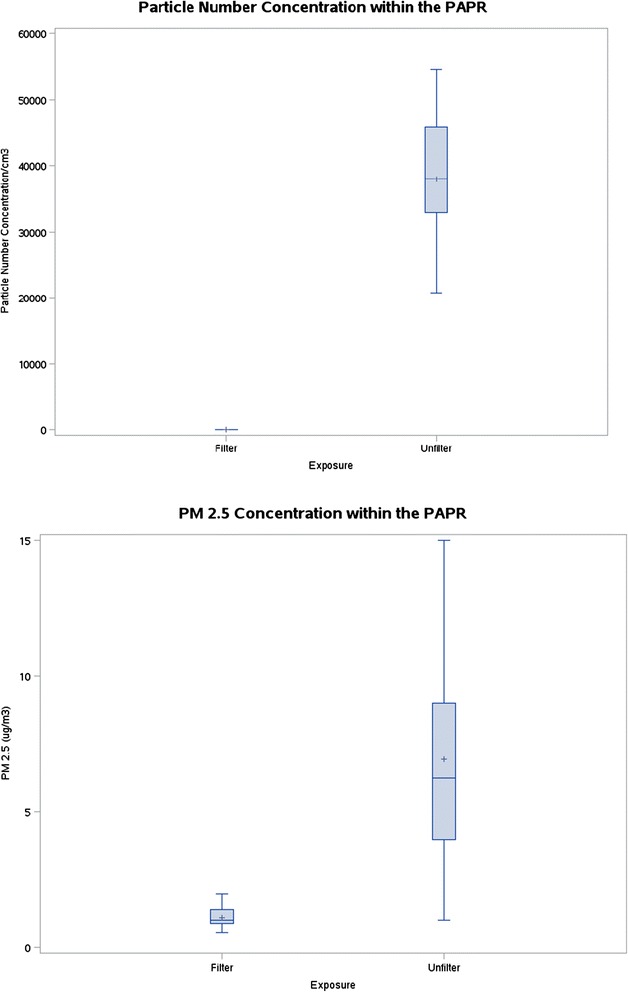
Box plots showing mean, median, 25th percentile, 75th percentile, and range of concentrations of particle number and PM2.5 concentrations measured inside the respirator (PAPR) facepiece.
Official websites use .gov
A
.gov website belongs to an official
government organization in the United States.
Secure .gov websites use HTTPS
A lock (
) or https:// means you've safely
connected to the .gov website. Share sensitive
information only on official, secure websites.
Box plots showing mean, median, 25th percentile, 75th percentile, and range of concentrations of particle number and PM2.5 concentrations measured inside the respirator (PAPR) facepiece.