
Figure 2.
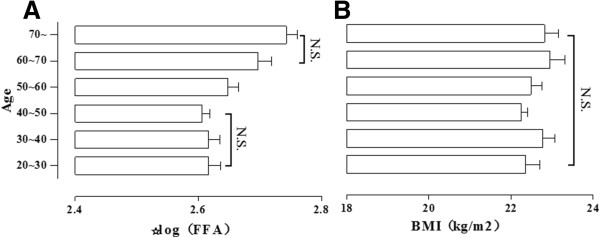
The change of FFA levels in different age. FFA levels (A) and BMI (B) in different group. ANOVA was followed by SNK-q test to determine differences between individual groups; Data are mean ± SD (N.S.: no statistically significant.
Official websites use .gov
A
.gov website belongs to an official
government organization in the United States.
Secure .gov websites use HTTPS
A lock (
) or https:// means you've safely
connected to the .gov website. Share sensitive
information only on official, secure websites.
The change of FFA levels in different age. FFA levels (A) and BMI (B) in different group. ANOVA was followed by SNK-q test to determine differences between individual groups; Data are mean ± SD (N.S.: no statistically significant.