
Figure 3.
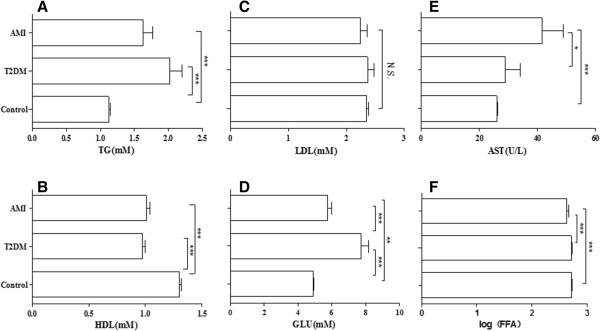
The description of six mainly levels in T2DM, AMI and control group. The histogram showed six mainly levels [TG (A), HDL (B), LDL (C), GLU (D), AST (E), FFAs (F)] Data are mean ± SD. *P < .05, **P < .01, ***P < .001; Three groups: Control (n = 143), T2DM (n = 52), AMI (n = 47).