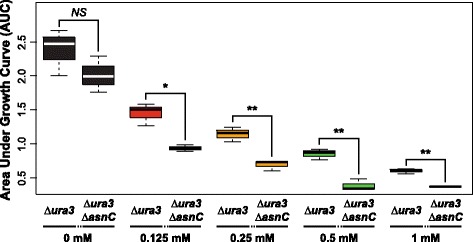
Figure 5.

Deletion of AsnC leads to growth defects in sub-inhibitory levels of PQ. Growth curves were conducted for 0, 0.125, 0.25, 0.5 and 1 mM PQ and significant differences of the area under the growth curve (AUC) were observed between ∆ura3 ∆asnC and ∆ura3 control strain only when PQ was added (p-value =2.2 × 10⁻¹, 2.4 × 10⁻², 5.6 × 10⁻³, 2.3 × 10⁻³, and 5.0 × 10⁻³; for 0, 0.125, 0.25, 0.5 and 1 mM PQ, respectively). ‘NS’: not significant, ‘*’: Student’s T-test p-value ≤0.05, ‘**’: Student’s T-test p-value <0.01.
