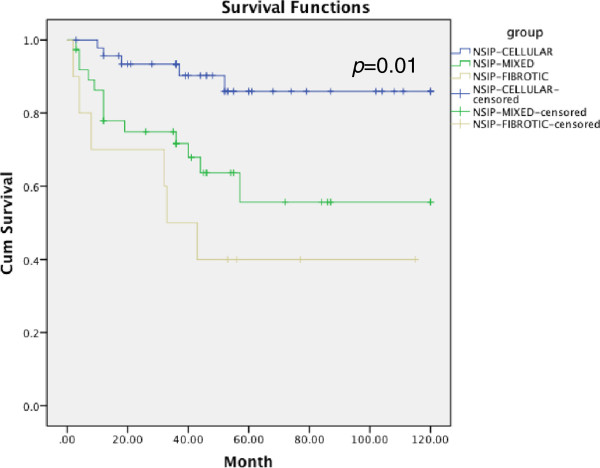
Figure 3.

Kaplan-Meier survival curve for NSIP patients divided by pathological pattern: cellular pattern vs mixed pattern =0.001; cellular pattern vs fibrotic pattern =0.000; Mixed pattern vs fibrotic pattern =0.451.

Kaplan-Meier survival curve for NSIP patients divided by pathological pattern: cellular pattern vs mixed pattern =0.001; cellular pattern vs fibrotic pattern =0.000; Mixed pattern vs fibrotic pattern =0.451.