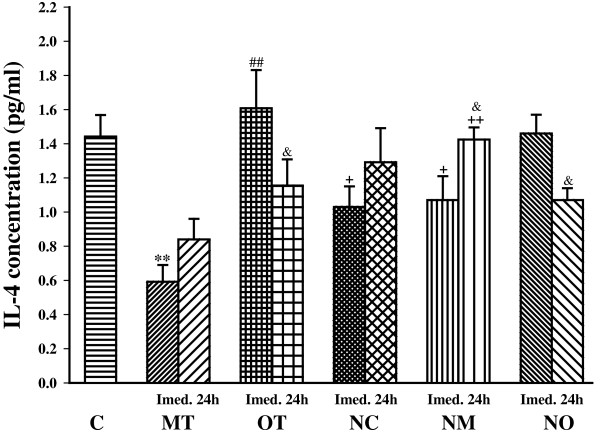
Figure 4.

The serum concentrations of IL-4 in non treated groups including; control sedentary rats (C), moderate trained (MT), overtrained (OT), and treated groups with N. sativa : control sedentary + N. sativa (NC), moderate trained + N. sativa (NM), overtrained + N. sativa (NO), (for each group, n = 6). **; P< 0.01, compared to control group. ##; P< 0.01, comparison between overtrained and moderate exercise.+; P< 0.05, ++; P< 0.01, comparison between treated and non treated groups. &; P< 0.05, comparison between immediately and 24 h after last bout of exercise.
