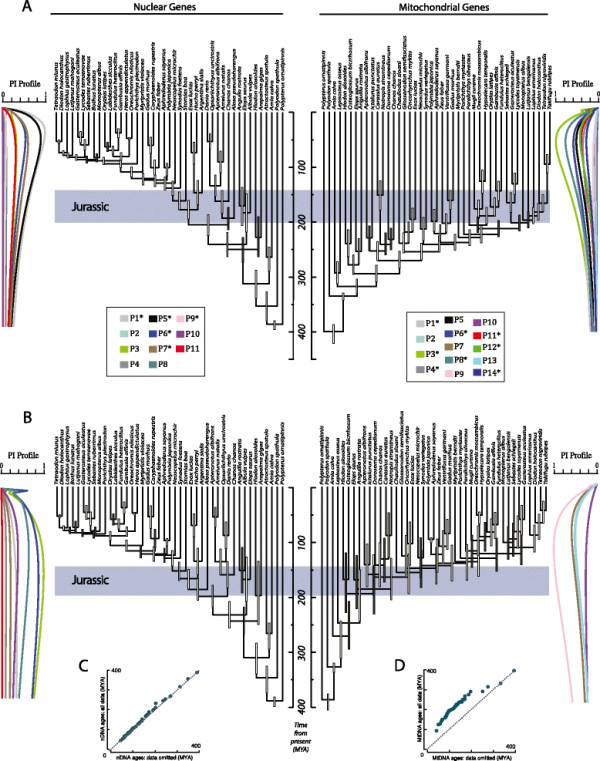
Figure 2.

Comparison of mtDNA and nDNA chronograms for actinopterygians. Ages were estimated by analyzing A) all data and B) analyzing data that excluded saturated partitions. Bars indicate 95% HPD intervals of age estimates. Light bars indicate posterior probabilities greater than 0.95. Gray bars indicate posterior probabilities below 0.95. Phylogenetic informativeness profiles for both datasets are shown adjacent to the associated chronograms. Colors identify individual partitions. C) Comparison of mtDNA mean age estimates for all nodes when all data is used and the mean ages from the pruned dataset. D) Comparison of nDNA mean age estimates for all nodes when all data is used and the mean ages from the pruned dataset.
