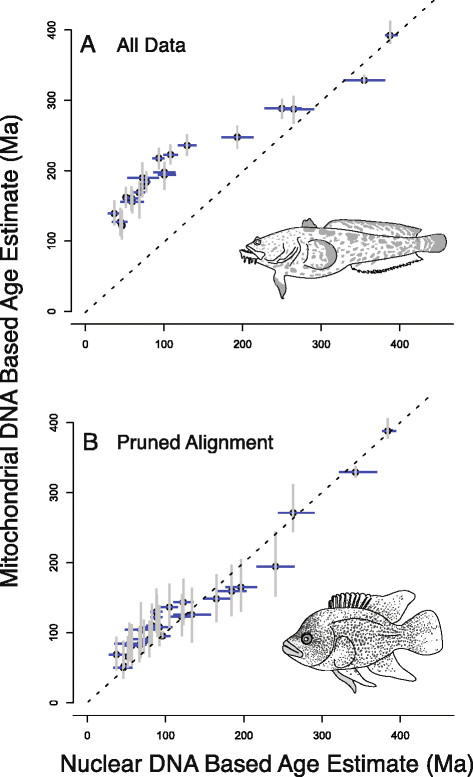
Figure 5.

Comparison of means and 95% HPD intervals for mtDNA and nDNA based posterior age estimates, (A) when all data from each dataset is included, and (B) when partitions are excluded from each dataset based on their PI profile. Black circles indicate mean age estimates, gray and blue bars respectively indicate the 95% HPD interval of the mtDNA and nDNA based analyses.
