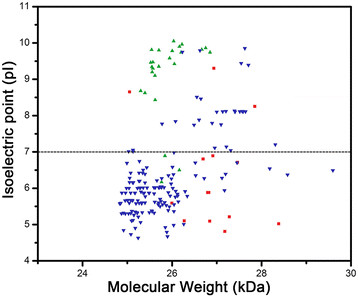
Figure 3.

Relationship between isoelectric point and molecular weight for the newly identified fungal MIP cluster and selected plant MIP subfamilies. Plot showing isoelectric point versus molecular weight for SIP-like MIPs (red squares), plant TIPs (blue inverted triangles) and plant SIPs (green triangles). One hundred eighty one plant TIPs from 45 species and 25 SIPs from 10 different plant species were considered for this analysis. See also Table 2 for details of the species.
