
Figure 6.
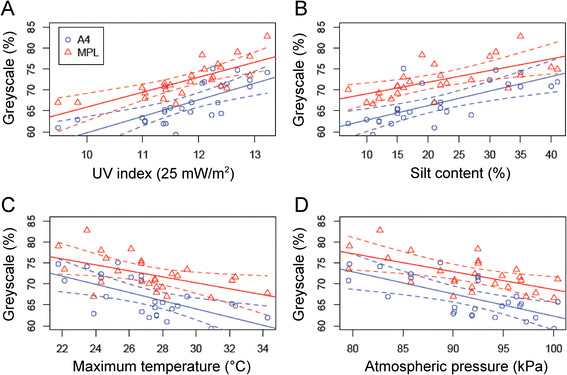
Linear regression of population means of A4 background (blue) and MPL (red) pigmentation scores on (A) ultra-violet (UV) index, (B) silt content, (C) average maximum temperature, and (D) atmospheric pressure, in sub-Saharan Africa.
Official websites use .gov
A
.gov website belongs to an official
government organization in the United States.
Secure .gov websites use HTTPS
A lock (
) or https:// means you've safely
connected to the .gov website. Share sensitive
information only on official, secure websites.
Linear regression of population means of A4 background (blue) and MPL (red) pigmentation scores on (A) ultra-violet (UV) index, (B) silt content, (C) average maximum temperature, and (D) atmospheric pressure, in sub-Saharan Africa.