Figure 7.

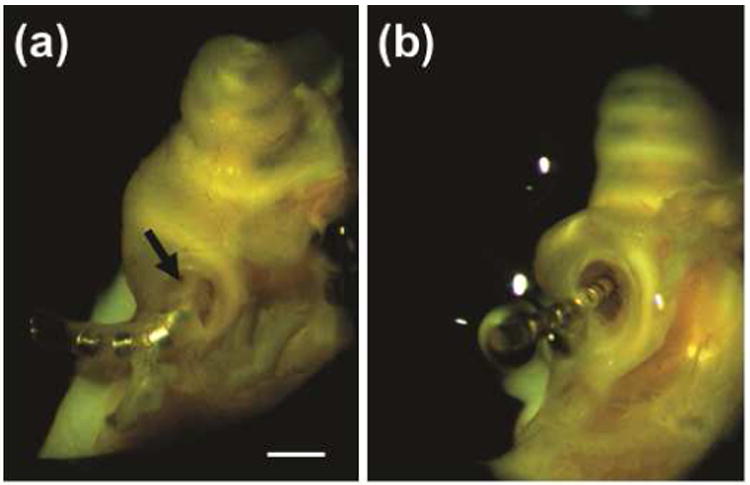
Stria vascularis measures. (a) Example digitized light microscopic image of the SV for an implanted animal without hearing loss (n8). (b) Example image of the SV for an implanted animal with hearing loss (n1). Black lines indicate borders of stria vascularis and vessels used for vascular density measurements (the proportion of stria vascularis occupied by vessels). (c) Statistically significant linear correlations between ABR threshold at 6 kHz at 16 weeks after implantation and SV vascular density in profile A (R= -0.598, p=0.009). (d) Statistically significant linear correlations between ABR threshold at 16 kHz at 16 weeks after implantation and vascular density in profile A (R= -0.511, p=0.030). Significant linear correlations indicated that the lower the vascular density in the CI electrode region, the more hearing loss was detected at 6 k and 16 kHz. (e) A significant positive correlation was also seen for total SV area versus ABR threshold at 6 kHz (R=0.534, p=0.029). This indicated that the higher the SV area in the electrode region, the more hearing loss was detected at 6 kHz. (f) A significant negative correlation was also seen for total SV blood vessel area versus ABR threshold at 6 kHz (R= -0.526, p=0.025). This indicates that smaller overall blood vessel size was associated with more hearing loss at 6 kHz.
