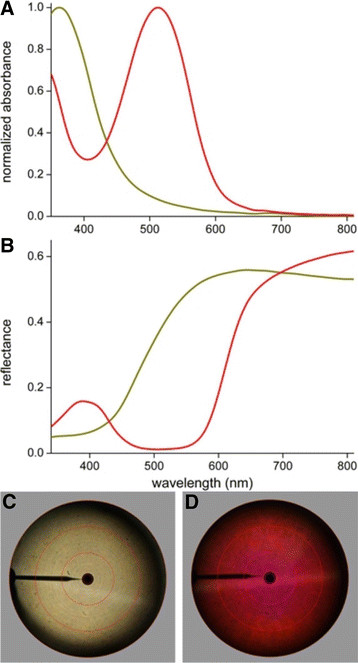
Figure 3.

Absorbance and reflectance spectra and scatterograms of single yellow and red wing scales ofP. aeanas bolivarandP. sesostris. A Absorbance spectra calculated from transmittance spectra measured of single wing scales immersed in refractive index matching fluid. B Reflectance spectra measured with a microspectrometer. C, D Scatterograms showing wide-angled, diffuse scattering of a single yellow scale of P. aeanas bolivar(C) and a single red wing scale of P. sesostris(D). The about horizontal lines are due to diffractive scattering by the scale ridges, which were oriented about vertically. The red circles indicate scattering angles of 5°, 30°, 60° and 90°, and the black bar at 9 o’clock is due to the glass micropipette holding the scale.
