
Figure 2.
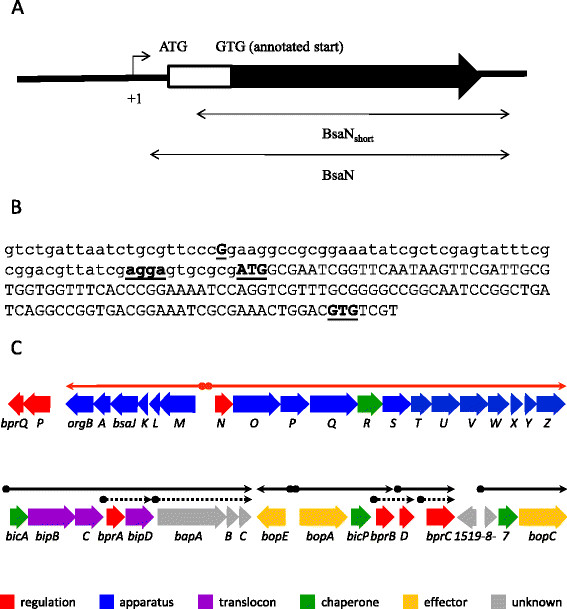
Transcriptional analysis ofbsaNand BsaN/BicA-regulated genes. A. Schematic diagram of the bsaN gene. Arrow above +1 indicates the transcriptional start site and direction. Double-headed arrows indicated the DNA fragments used for the reconstitution of BsaN-mediated promoter activation experiments. B. Promoter region indicating the transcriptional start site and start codon of bsaN. Bold and underlined letter G indicates the transcriptional start site (+1 in 2A). Bold and underlined agga indicate the putative RBS. Bold and underlined ATG and GTG indicate the actual and wrongly annotated start codons of bsaN, respectively. C. Genetic and transcriptional organization of T3SS3 genes. Arrows indicate transcriptional units. Putative promoter regions are depicted as shaded spheres at the beginning of line arrows. Red line arrows denote operons regulated by BprP. Black line arrows indicate operons regulated by BsaN. Black dotted arrows with shaded diamonds represent putative promoters that were analyzed for direct activation by BsaN/BicA, however, no expression was found (Additional file 1: Table S2).