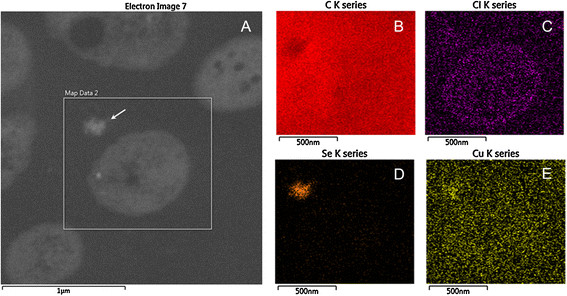
Figure 4.

Localization of selenium particles using EDS Elemental Mapping. (A) The box showed the mapping area of B-E, where the K series peaks of the elements was used for mapping. The arrow points to an extracellular selenium particle. B, C, D and E show the distribution of different elements of C (from cell and Epon), Cl, Se and Cu (from Cu grids), respectively.
