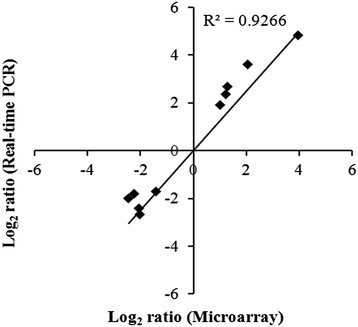
Figure 2.

Comparison of transcription measurements by microarray and qRT-PCR. The relative transcription levels for 10 genes are listed in Table 6. The qRT-PCR log2 values were plotted against the microarray data log2 values. The correlation coefficient (r) for comparison of the two datasets is 0. 92.
