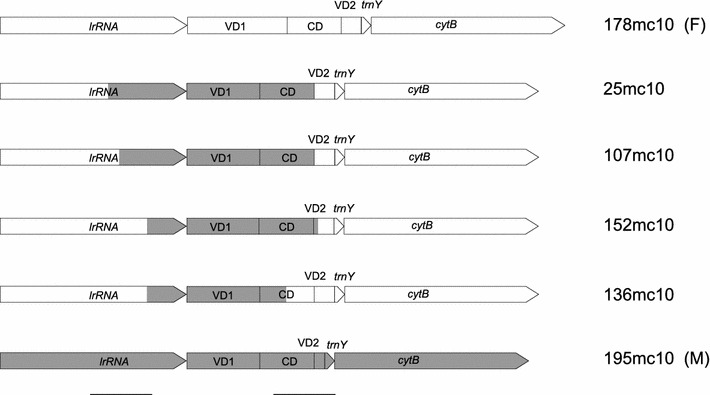
Fig. 1.

Schematic diagram of the CR structure of the four recombinant haplotypes from the 1a haplogroup (25mc10, 107mc10, 152mc10 and 136mc10). Typical F (178mc10) and M (195mc10) structures are shown for comparison. The shaded boxes represent regional similarities to the M genomes; open boxes represent F-related regions. All haplotypes were aligned at the lrrna. Alignments of the two regions containing recombination breakpoints (indicated by vertical lines below the figure) are presented in Fig. 2
