
Figure 3.
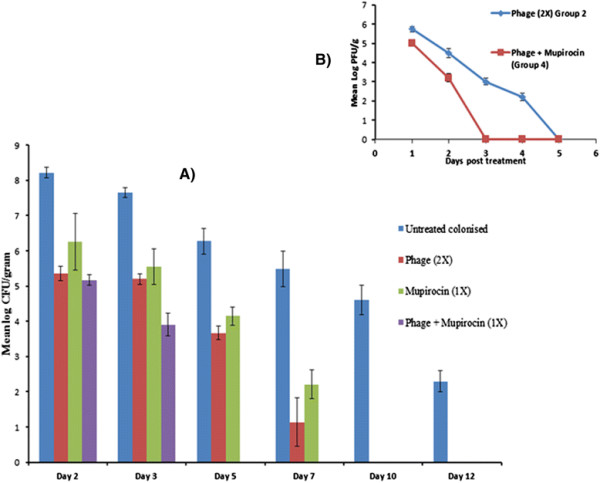
Bacterial burden in terms of A) Mean log CFU/gram of mice tissue ofS. aureus43300 following treatment of colonised nares with different anti-bacterial agents on different days post treatment; Phage counts in terms of B) Mean log PFU/g count in the anterior nares of mice belonging to group 2 and group 4 on various days post phage treatment. Error bars represent the standard deviation.