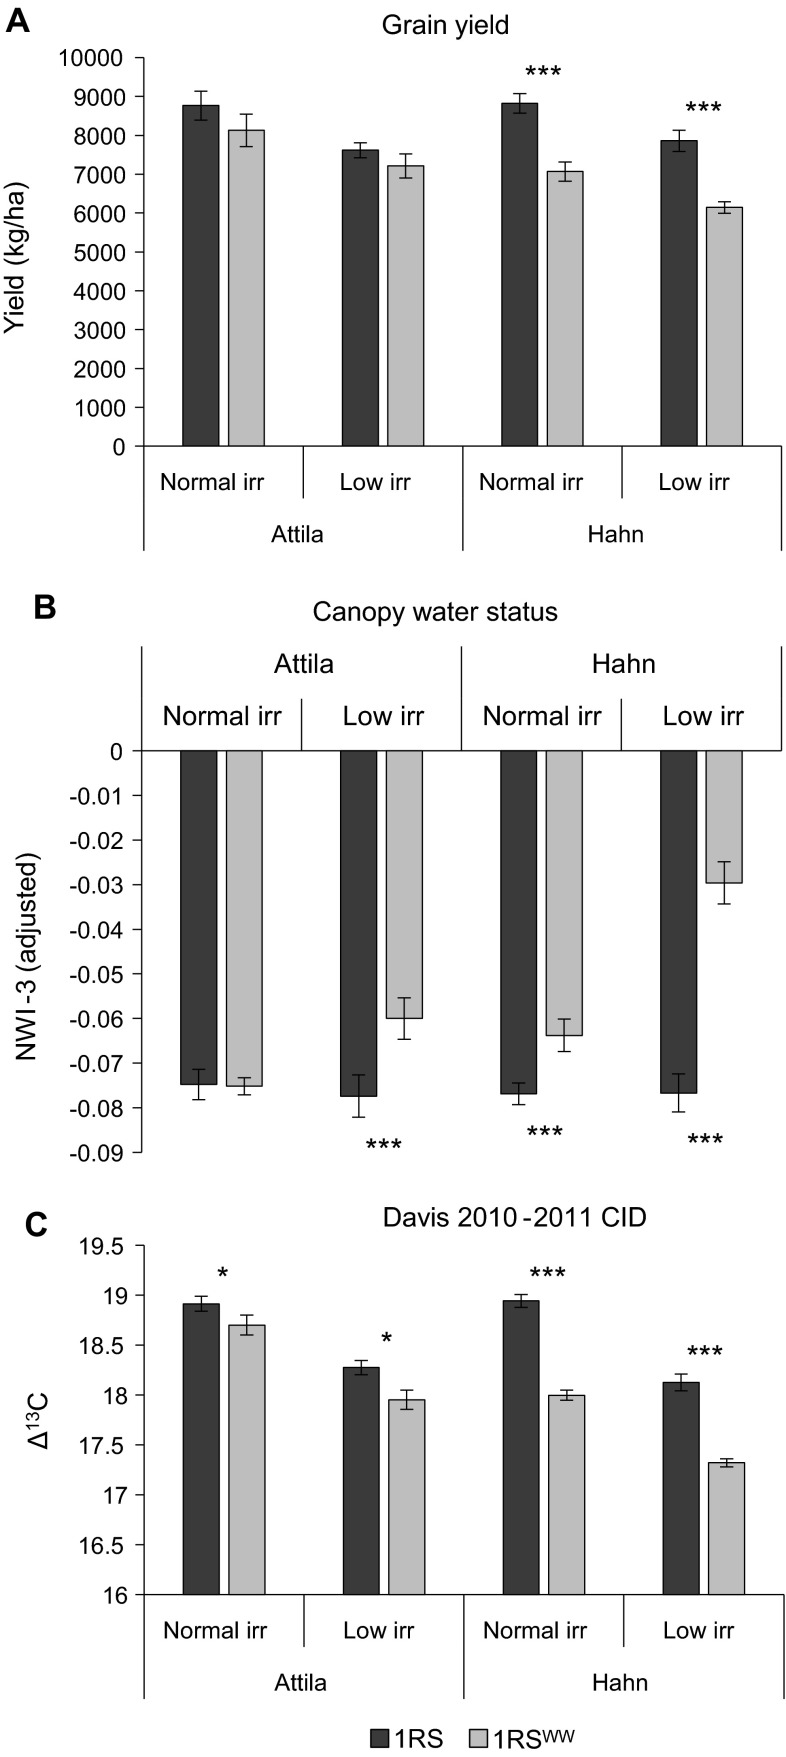
Fig. 4.
A comparison of the adjusted mean yields, NWI-3 and CID values between 1RS and 1RSWW genotypes in the Hahn and Attila backgrounds under two different irrigation regimes (Davis 2010–2011). a Adjusted mean plot yield. b Adjusted mean canopy water status estimated by NWI-3 (more negative values indicate better canopy water status) as measured on May 6th and May 10th 2011. c Adjusted mean carbon isotope discrimination values measured on flour from mature grains

