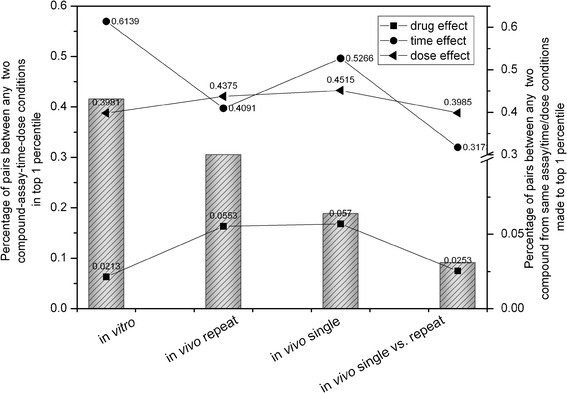
Figure 3.

Analysis of the top 1% nearest pairs (92,600 pairs) of any two compound-assay-dose-time experiment condition. The bar chart (left axis) shows the percentage of pairs from individual assays in the top 1% pool while the line plot (right axis) assessed the treatment effect by drug, dose and time.
