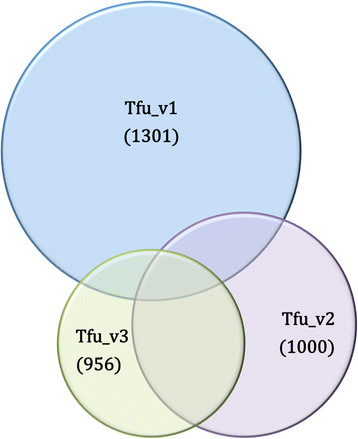
Figure 4.

Summary of three versions of models created in this study: Reaction distribution across the 3 versions is represented in the figure. All three versions had 170 reactions in common. Following was the common reaction across each compared pair of model versions: Tfu_v1: SEED AND Tfu_v2:yaml: 195, Tfu_v2:yaml AND Tfu_v3: Proteomics: 417, Tfu_v1: SEED AND Tfu_v3: Proteomics: 185.
