Figure 5.

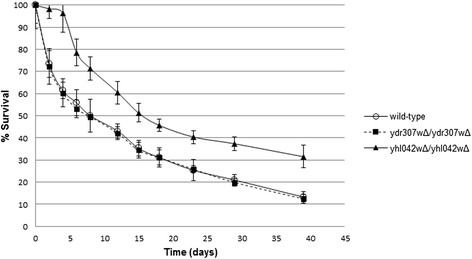
Survival curves ofS. cerevisiaestrains. The error bars denote the standard deviations of the two biological and two technical replicates.

Survival curves ofS. cerevisiaestrains. The error bars denote the standard deviations of the two biological and two technical replicates.