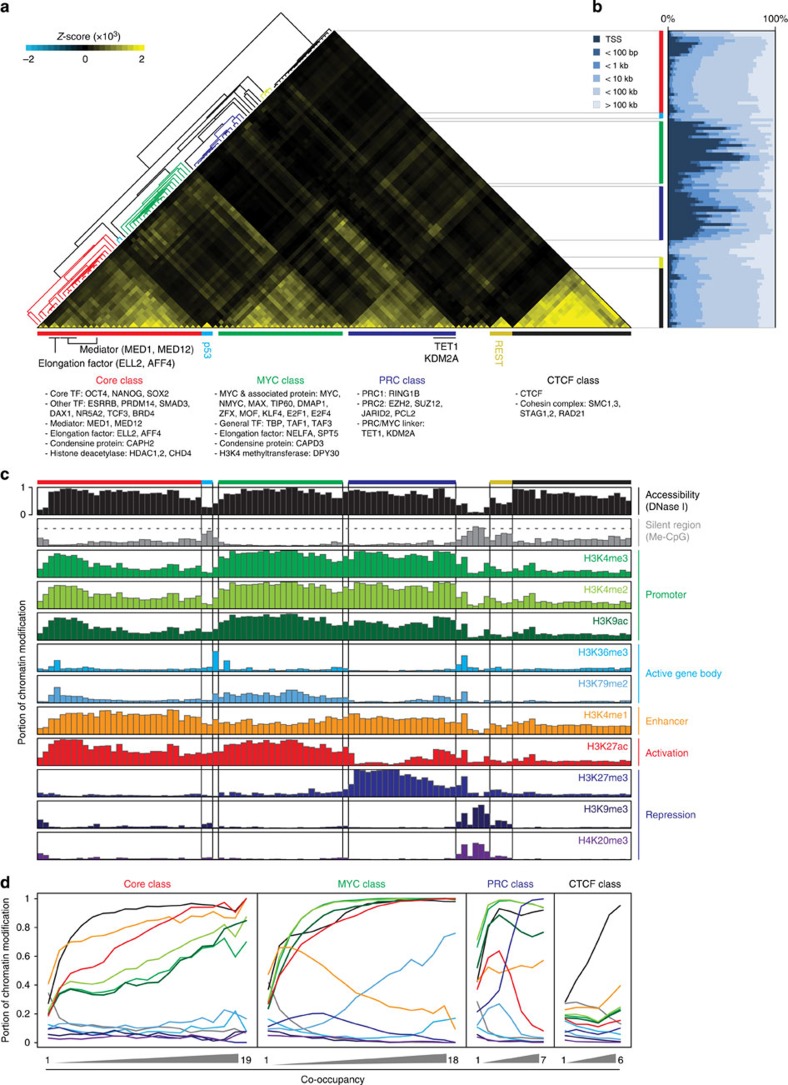
Figure 1. Co-occupancy guided identification of DBP classes and their associated chromatin status.
(a) Co-occupancy guided classifications of DBPs. Heatmap shows six distinctive clusters (colour-coded bars) from an unsupervised hierarchical clustering of co-occupancies for 105 DBPs. Representative DBPs and their putative functions are shown below. The extent of co-occupancy between two DBPs was monitored with the deviation of actual co-occupancy from randomized expectation (Z-score, see Methods section). Red: Core class (19 DBPs, 29 experiments), blue: PRC class (7 DBPs, 21 experiments), green: MYC class (18 DBPs, 22 experiments), black: CTCF class (6 DBPs, 21 experiments), cyan: P53 class (single DBP, 2 experiments) and yellow: REST class (single DBP, 4 experiments). (b) Distance distribution of DBP-binding sites from transcriptional start sites (TSSs). DBPs are listed in the same order as in Fig. 1a. Note that DBP-binding sites in the PRC and MYC classes are generally enriched nearby TSSs, while the binding sites of the Core and CTCF classes are further away from TSSs. (c) Association of each DBP class with a unique chromatin status. Each colour-coded bar graph, excluding me-CpG, shows the portion containing a specific histone mark or DNase I hypersensitivity (y axis) within the given DBP-binding sites (x axis, same order as in Fig. 1a). Me-CpG (grey) indicates the average portion (y axis) of CpG methylation within the given DBP-binding sites (x axis). Genome-wide average portion of CpG methylation (0.6474) is shown with a grey dashed line. (d) Association of increased co-occupancy of DBPs within the class with specific histone marks. The portions containing chromatin marks or percentage of CpG methylation (y axis) within the centre (300 bp) of the region co-occupied by indicated number of DBPs (x axis) are plotted with different colour as indicated in Fig. 1c.

