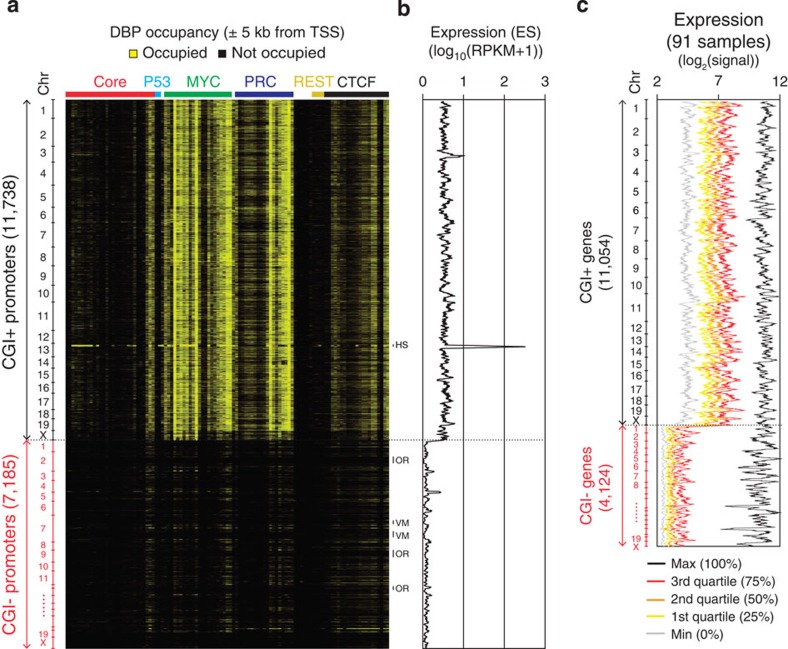
Figure 2. Predominant regulation of the MYC and PRC classes on CGI+ promoters.
(a) Heatmap presenting DBP occupancies (same order as in Fig. 1a) within±5 kb from TSSs of CGI+ and CGI− genes (vertical, chromosomal order). Gene clusters showing distinct binding patterns are shown on the right as follows. HS, histone gene cluster; OR, olfactory receptor gene cluster; VM, vimentin gene cluster. (b) The expression value of each gene in ES cells is plotted using a moving average (window size: 64, bin size: 1; genes are in chromosomal order as in Fig. 1a) across CGI+ and CGI− genes. Expression levels are shown in log10(RPKM+1) scale. RPKM, reads per kilobase per million. (c) Moving average plots (window size: 64, bin size: 1; genes are in chromosomal order) showing global gene expressions of 91 different tissues or cell lines (http://biogps.gnf.org)34. Expression values are ranked for each gene, and maximum, quartiles and minimum values among samples are plotted with different colours as indicated.

