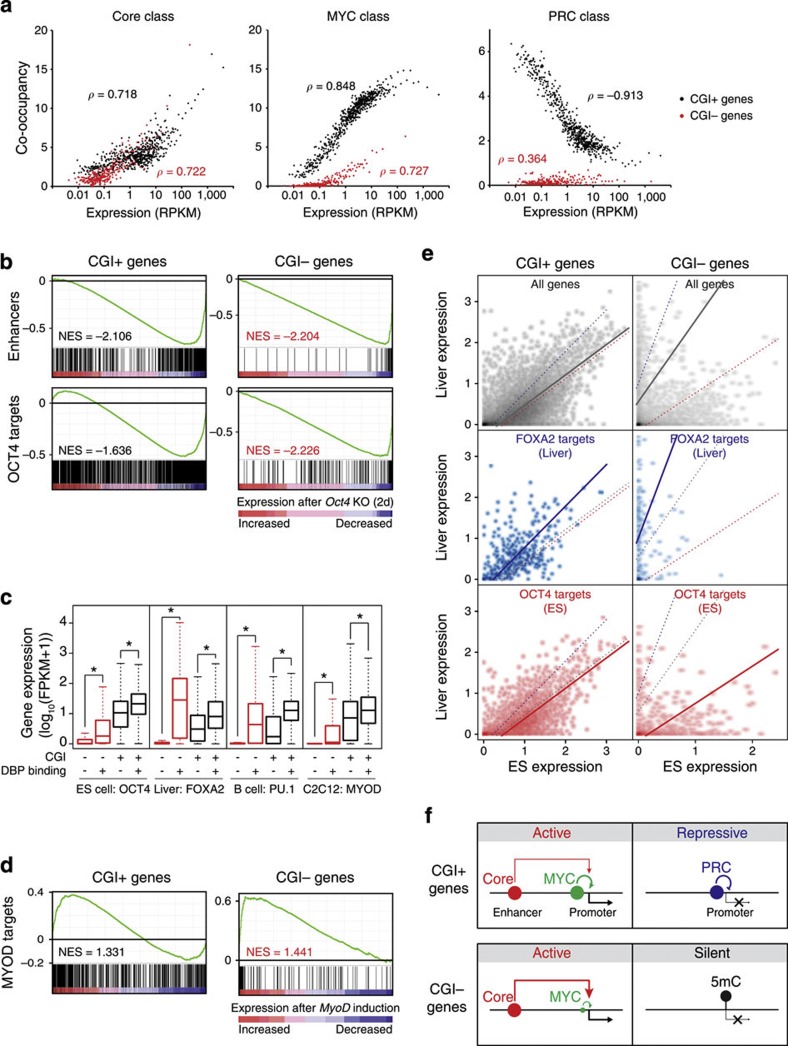
Figure 6. Enhancer-binding master regulators control the activity of tissue-specific CGI− genes in addition to general activity of CGI+ genes.
(a) Correlations between the co-occupancy of DBPs in each class and the expression of CGI+ (black dots) or CGI− (red) target genes. Genes were sorted with expression levels and binned into every 20 genes. Each dot represents an average expression and co-occupancy of a group of genes. Gene groups with an average RPKM >0.01 are shown. ρ indicates Spearman correlation coefficient. (b) Gene set enrichment analyses (GSEA) using gene expression profile from conditional Oct4 KO ES cells (GSE10477; ref. 62). Gene sets for enhancers (Fig. 5a) and OCT4 targets (±5 kb from TSS, GSM288354; ref. 13) were used. NES (normalized enrichment score). (c) Box plots showing the effect of tissue-specific enhancer-binding master regulators on their CGI+ (black boxes) or CGI− (red) targets. Specific cell types and tissue-specific master regulators are indicated. Target genes were assigned within±5 kb from the centre of the binding sites. FPKM, fragments per kilobase per million. *ρ<2.2e−16 (Wilcoxon signed-rank test). (d) GSEA using gene expression profile from MyoD induction in MEF cells (GSE6487)64 and MYOD targets (GSE36024)59. (e) Enhancer target gene expression (CGI+ or CGI− genes) between ES cells and liver cells. Expression of all genes (grey dots), FOXA2 targets (blue) and OCT4 targets (red) are shown in two-dimensional dot plots. Coloured trend lines are from least square linear regressions of each test. Gene expressions are shown as log10(FPKM+1). (f) A model of CGI-mediated global gene regulatory modes in ES cells. The MYC and PRC classes reciprocally regulate CGI+ genes, whereas the Core class regulates both CGI+ and CGI− target genes. A majority of CGI− genes are silent with DNA methylation while only a small subset of them are activated by the Core and MYC classes.

