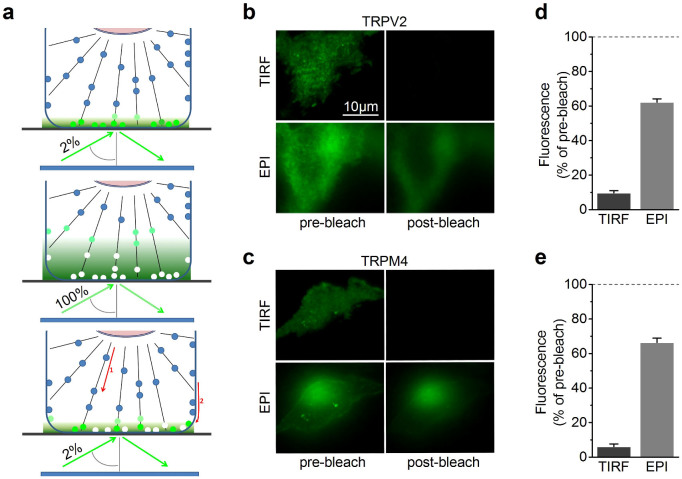
Figure 1. Scheme of the TIR-FRAP experiment.
(a) Low intensity (2% of maximal laser power) TIRF illumination was applied during both the pre-bleach (top) and post-bleach-recovery phase (bottom). During the bleaching phase, the TIRF angle was maintained, but laser power was increased to 100%. (b,c) Epifluorescence and TIRF micrographs of TRPV2-GFP and TRPM4-GFP transfected in HEK293 cells before and immediately following bleaching. (d,e) Fluorescence intensities in epifluorescence and TIRF normalized to the respective pre-bleach intensities.

