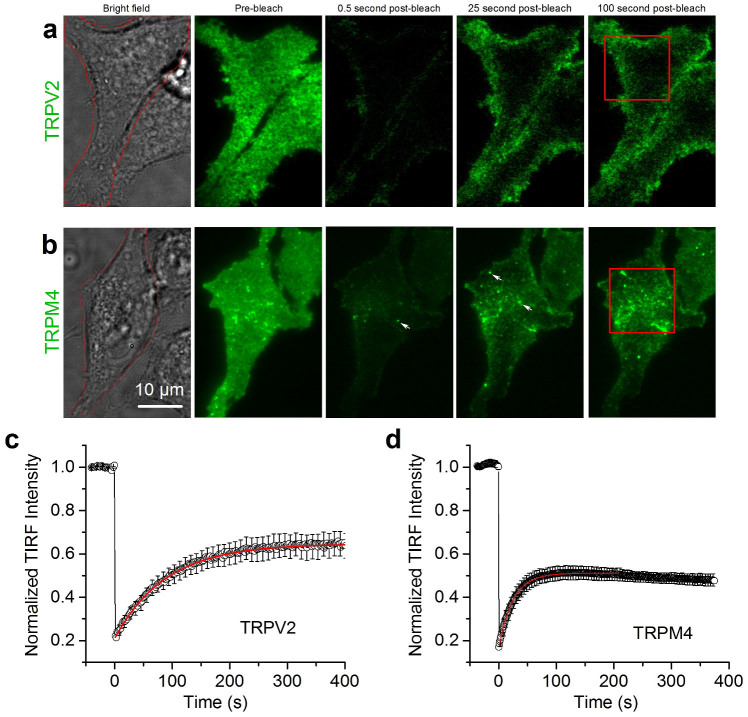
Figure 2. Global fluorescence recovery in TIR-FRAP.
(a,b) Brightfield (left) and TIRF micrographs at the indicate time points of HEK293 cells expressing TRPV2-GFP and TRPM4-GFP. The red squares depict the regions shown in movies 1 and 2. Arrows indicate incoming and subsequently fusing TRPM4-GFP-containing vesicles. (c,d) Average time course of normalized fluorescence during TIR-FRAP experiments for TRPV2-GFP and TRPM4-GFP. Time 0 corresponds to the start of the post-bleach recovery.

