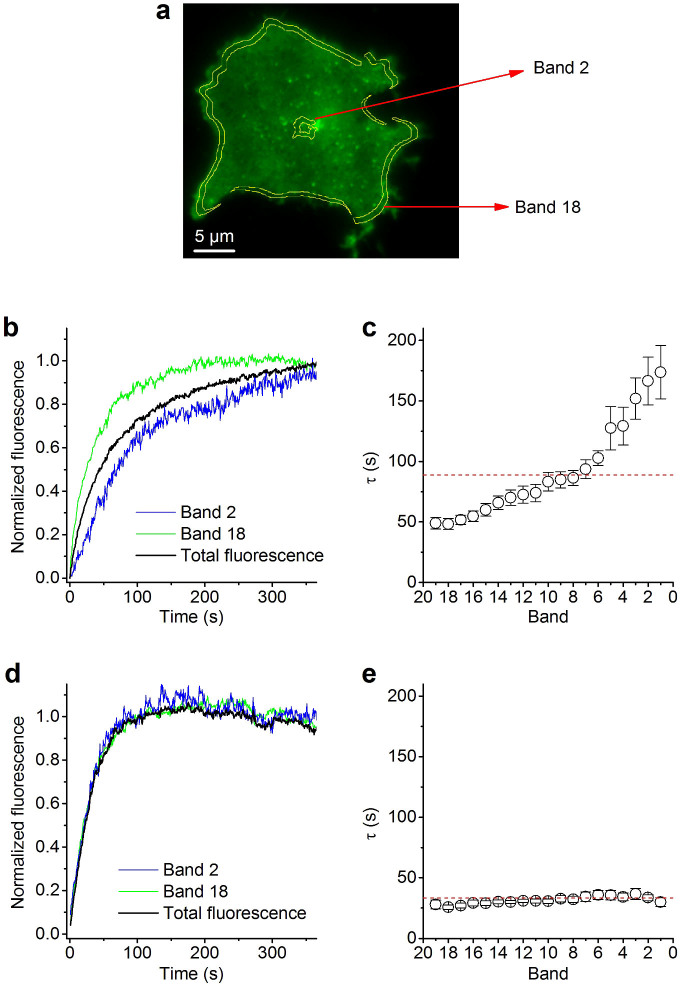
Figure 3. Spatio-temporal analysis of post-bleach recovery.
(a) TIRF micrograph showing the footprint of a TRPM4-GFP-expressing cell. Superimposed are bands 2 and 18 of the 20 concentric, equally shaped and equidistant bands that were used to analyze the spatio-temporal aspects of fluorescence recovery. (b) Normalized TRPV2-GFP fluorescence following bleaching in a central and peripheral band, along with the global fluorescence of the entire footprint. (c) Exponential time constants for the recovery of fluorescence in the different bands. (d,e) Same as (b,c) but for cells expressing TRPM4-GFP.

