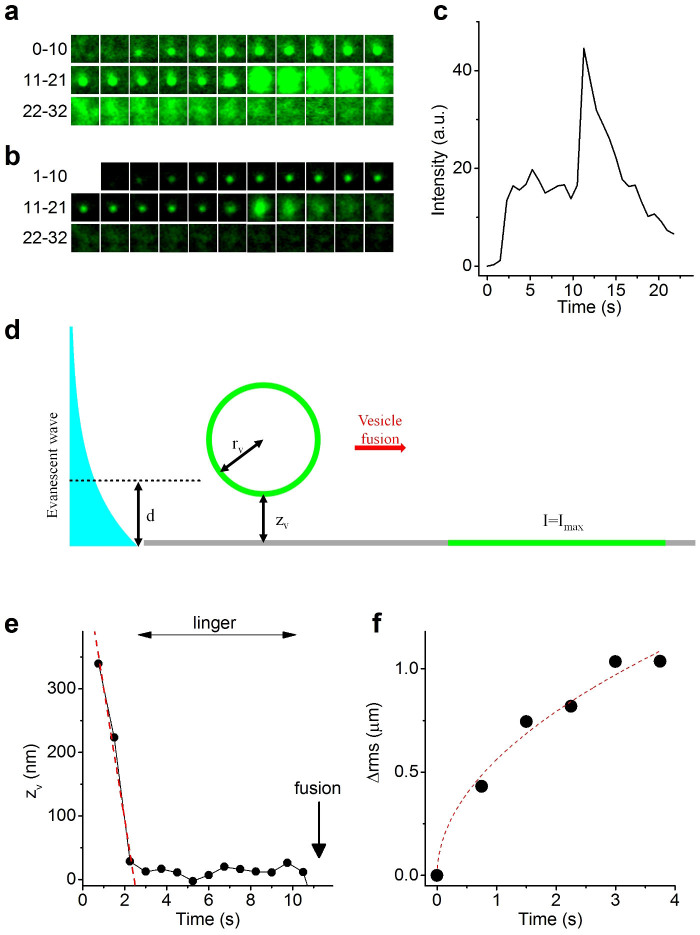
Figure 4. Full fusion of TRPM4-containing vesicles.
(a) Successive 1.2 μm×1.2 μm frames at 750-ms interval of a fusion event of a TRPM4-GFP carrying vesicle. (b) Same as (a), but after subtraction of frame 0. (c) Time course of background-subtracted fluorescence. (d) Cartoon showing a fluorescent vesicle within the evanescent wave, and after full collapse with the plasma membrane. (e) Time course of zv showing vesicle approach and lingering before fusion. Red dotted line represents a linear fit, yielding a speed in the z-direction of 207 nm/s. (f) Increase in rms after fusion. Red dotted trace represents a fit of equation 3, yielding D = 0.078 μm2/s. Analyses in (c–f) are all for the fusion example shown in (a,b).

