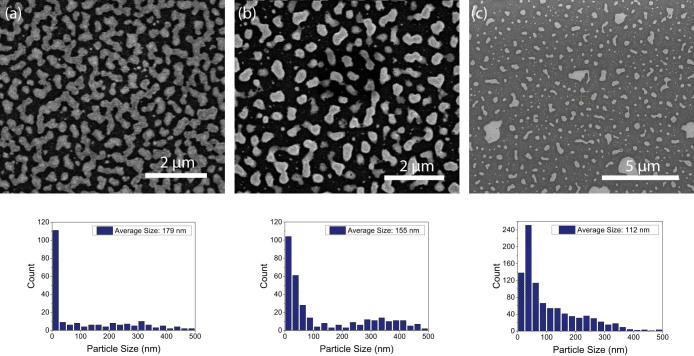
Figure 2. SEM image of the samples annealed at (a) 300°C, (b) 450°C, and (c) 600°C.
The sample annealed at 300°C has a semi-continuous Au film. Nanoparticles are formed on the other two samples and increasing the annealing temperature results in smaller particles. Particle size distribution histogram of each sample is plotted under the corresponding SEM image. The population of smaller particles augments with increasing annealing temperature.

