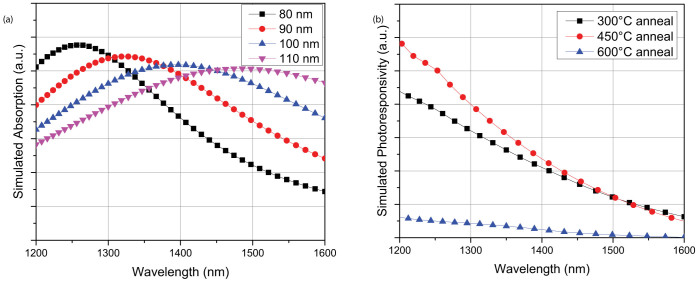
Figure 4.
(a) Absorption spectra of 10 nm-thick single nanoparticles with different sizes calculated using FDTD simulations. (b) Calculated photoresponsivity curves of three photodetectors. Photoresponsivity values are calculated using Fowler function adjusted by simulated absorption spectra (φB ≈ 0.7 eV).

