
Figure 7.
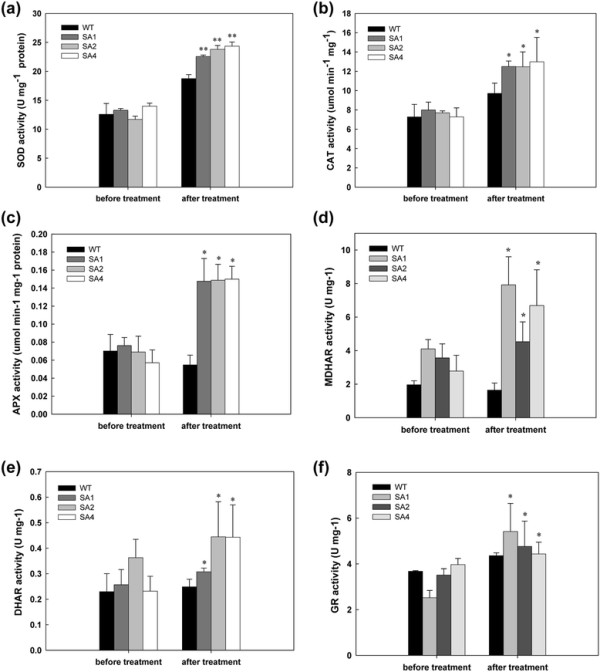
Changes of enzymatic activities of SOD (a), CAT (b), APX (c), MDHAR (d), DHAR (e) and GR (f) between WT and transgenic cassava during cold treatment. WT, wild-type control; SA1, SA2 and SA4, independent transgenic plant lines. Data presented as mean ± SD from triplicate independent measurements. *Significance at 5% level from WT by t-test, **Significance at 1% level from WT by t-test.