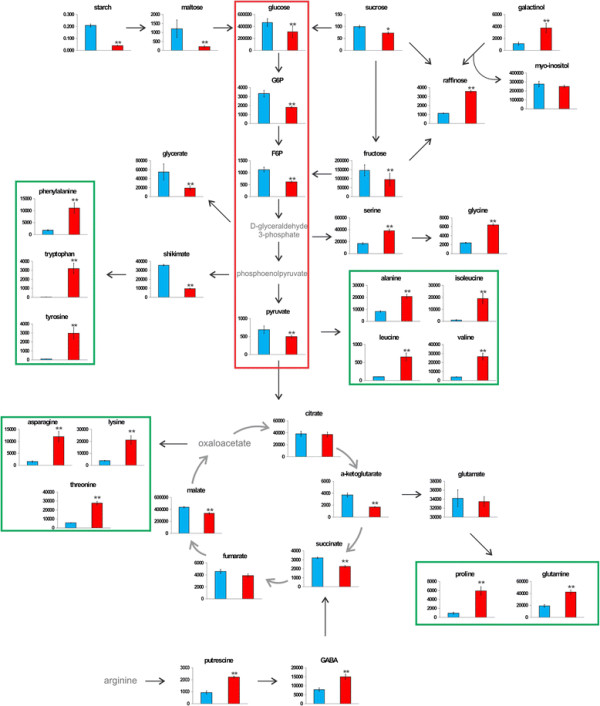
Figure 3.

Mapping of relative metabolite concentrations on known pathways for cotyledons ofRicinus communisgenotype MPA11. Seedlings were grown at 20°C (blue columns) or at 35°C (red columns). Data means and standard errors of three biological replicates containing 15–18 seedlings each are shown. Metabolites in grey (without column graphs) were not detected. Sucrose content was determined by HPLC. *p < 0.05 **FDR < 0.01.
