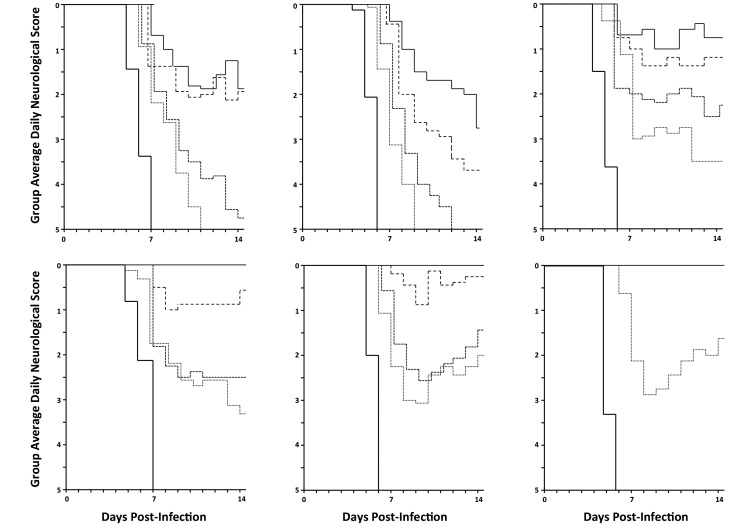
Figure 3.
Neurologic symptoms in mice treated with GCV compared with CDV. Mice were infected with the virus indicated at top, treated with GCV or CDV as described in Figure 1, and scored for neurologic symptoms. GCV doses (mg/kg daily) shown are 200 (solid line), 100 (large dashed line), 50 (small dashed line), and 25 (dotted line). CDV doses (mg/kg daily) were 100 (solid line), 50 (large dashed line), 25 (small dashed line), and 12.5 (dotted line). No-drug controls are indicated by heavy solid lines.

