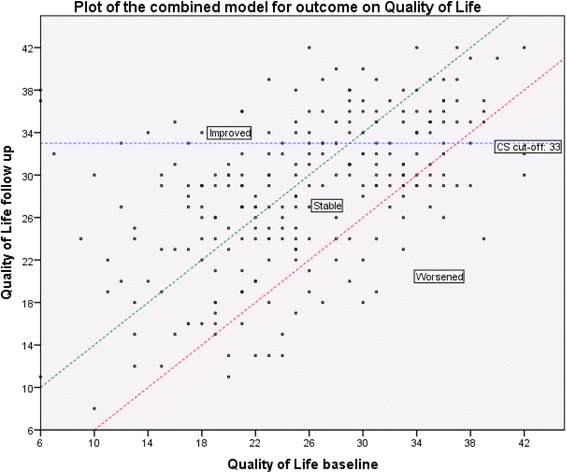
Figure 1.

Outcome on quality of life, a combination of SEM and CS cut-off.
Legend: The horizontal axis represents the baseline Quality of Life (QoL) total score and the vertical axis represents the follow up QoL total score. Each data point represents the combination of the baseline and follow-up QoL total score and illustrates if QoL improves, stabilizes, or worsens over time. The horizontal line represents the clinical significance cut-off between low level of QoL and high level of QoL at follow-up. The diagonal lines represent meaningful change in QoL total score.
