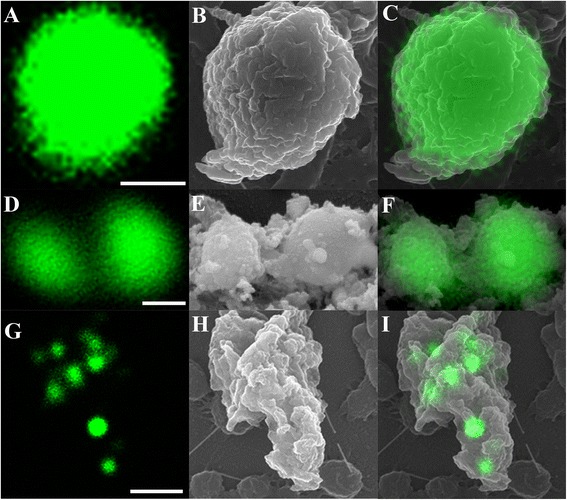
Figure 7.

Direct correlation of Cryptosporidium stages using confocal microscopy (A, D, G) and SEM (B, E, H). (C, F, I) Superimposed confocal and SEM images; (A-C) Single trophozoite; (D-F) Free type II merozoites; (G-I) Type I meront containing type I merozoites. Scale bars = A: 1 μm; D: 0.5 μm; G: 2 μm.
