Figure 8.

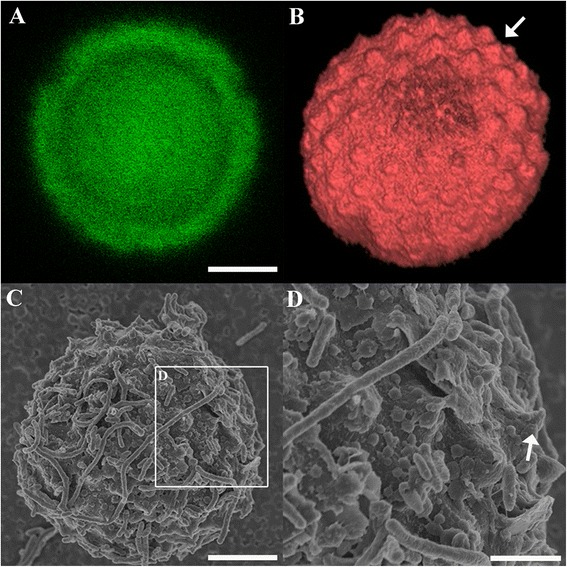
Correlation of a meront completely enveloped by a PV (arrowhead) under confocal microscopy (A, B) and SEM (C-D). B) The three dimensional Z-stack images of image A. D) Magnified area depicted in image C showing undulating membrane peaks (arrow). Scale bars = A & C: 5 μm; D: 2 μm.
