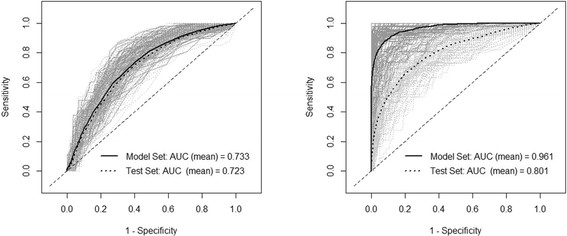
Figure 3.

ROC curves of the predictive power of the models. ROC curves of the multivariate logistic regression model (left) and the boosted regression tree model (right) on presence/absence of PRRS, from August to December 2010 at the sub-district level. The grey lines represent curves from individual bootstraps, and the thick black lines represent the average AUC curve estimated on the training set (continuous line) and test set (dotted line).
