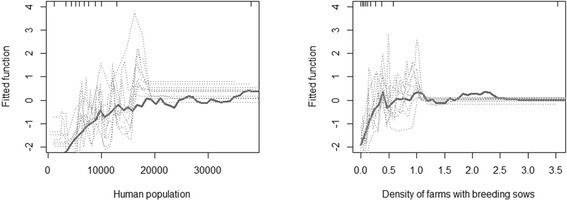
Figure 4.

Fitted function predicted by the BRT. Partial dependence plots show the effect of a predictive variable on the response after accounting for the average effects of all other variables in the model; fitted function for the number of human population (left) and the density of farms with breeding sows (right)
