Figure 8.

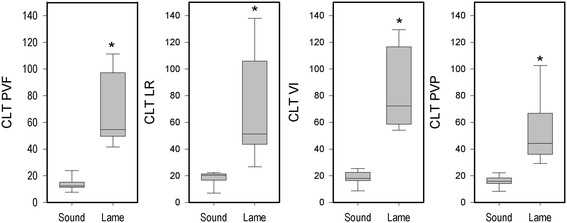
Boxplots for CLT for PVF, LR, VI and PVP for the lame and sound groups. *This group differs from the sound group (P < 0.05).

Boxplots for CLT for PVF, LR, VI and PVP for the lame and sound groups. *This group differs from the sound group (P < 0.05).