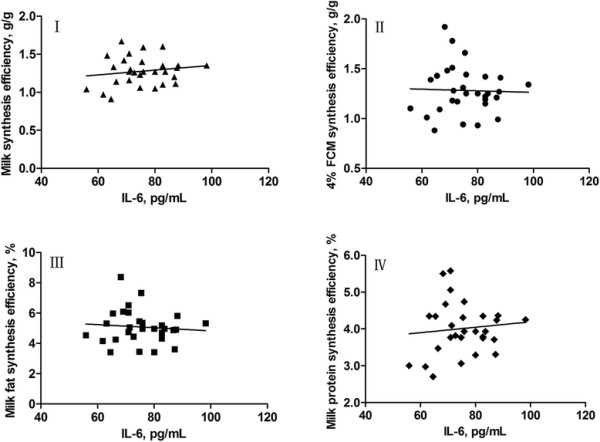
Figure 4.

Linear models fitted to data of milk synthesis efficiency (I), 4% FCM synthesis efficiency (II), milk fat synthesis efficiency (III), and milk protein synthesis efficiency (IV), which are expressed asy, in response to concentrations of IL-6 (expressed asx) in mammary gland venous plasma of dairy cows. I, y = 0.0031x + 1.041 (R2 = 0.0257, r = 0.1603, SE = 0.1862, P = 0.3979, n = 30); II, y = −0.0008x + 1.343 (R2 = 0.0010, r = −0.0316, SE = 0.2448, P = 0.8671, n = 30); III, y = −0.0103x + 5.856 (R2 = 0.0079, r = −0.0889, SE = 1.120, P = 0.6408, n = 30); IV, y = 0.0074x + 3.455 (R2 = 0.0102, r = 0.1001, SE = 0.7019, P = 0.5956, n = 30).
