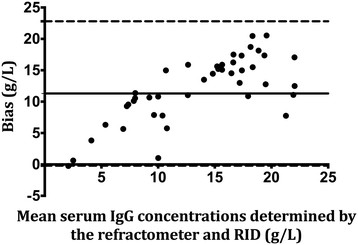
Figure 2.

Bland-Altman plots of serum IgG concentrations concurrently determined by RID and refractometer. Bias was calculated as the serum IgG concentration determined by RID minus the corresponding paired analyte concentration as determined by the refractometer. The solid represents the mean bias whereas the dashed lines represent the 95% limits of agreement (mean ± 1.96 SD).
