
FIG. 1.
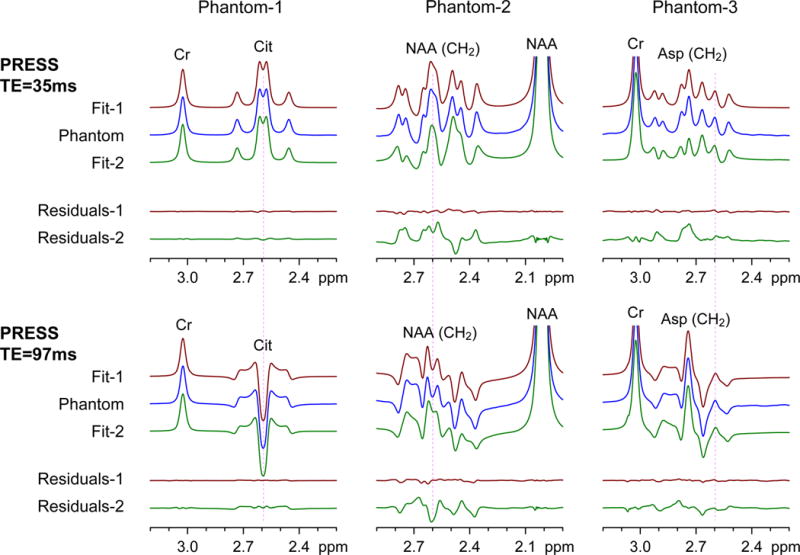
Phantom spectra of Cit (Phantom-1), NAA (Phantom-2), and Asp (Phantom-3), obtained with PRESS TE = 35 and 97 ms at 3T, are shown together with LCModel fitting results. The spectral fitting was undertaken with basis spectra that were calculated using the PRESS volume-localization RF and gradient pulses (Fit-1 and Residuals-1) and using 1-ns (non-localizing) 90° and 180° RF pulses (Fit-2 and Residuals-2). Residuals represent subtraction of calculated spectra from phantom spectra. Spectra were broadened to have singlet linewidths (FWHM) of 4.3 Hz prior to LCModel fitting. Spectra are normalized to the Cr or NAA singlet amplitude. A vertical line is drawn at 2.6 ppm.