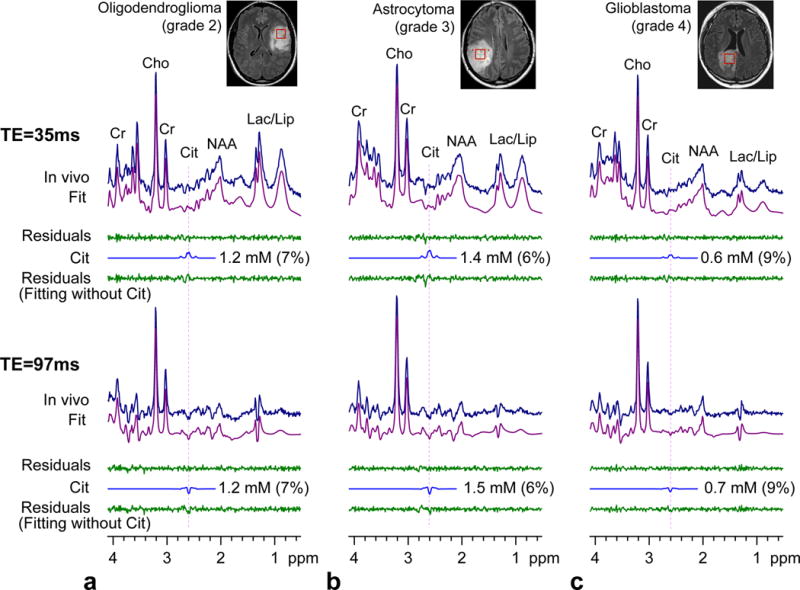
FIG. 4.

In vivo spectra from 3 subjects with gliomas, obtained with PRESS TE = 35 and 97 ms at 3T, are shown together with LCModel fits, residuals, and the Cit signals. The Cit concentration estimate and CRLB are presented for each patient. Data are shown in a similar manner as in Fig. 3.
