
FIG. 5.
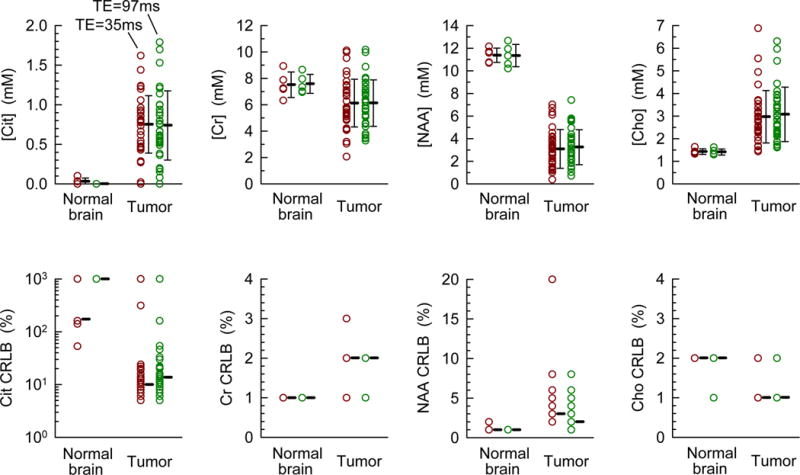
Concentrations and CRLBs of Cit, Cr, NAA, and Cho in 5 healthy volunteers and 32 adult patients with gliomas, obtained with PRESS TE = 35 and 97 ms are shown here. In the upper panel, the error bars represent the standard deviation of the concentration with respect to the mean values which are indicated by thick bars. The median value of the integer CRLBs (returned by LCModel) is shown as a bar in the lower panel.