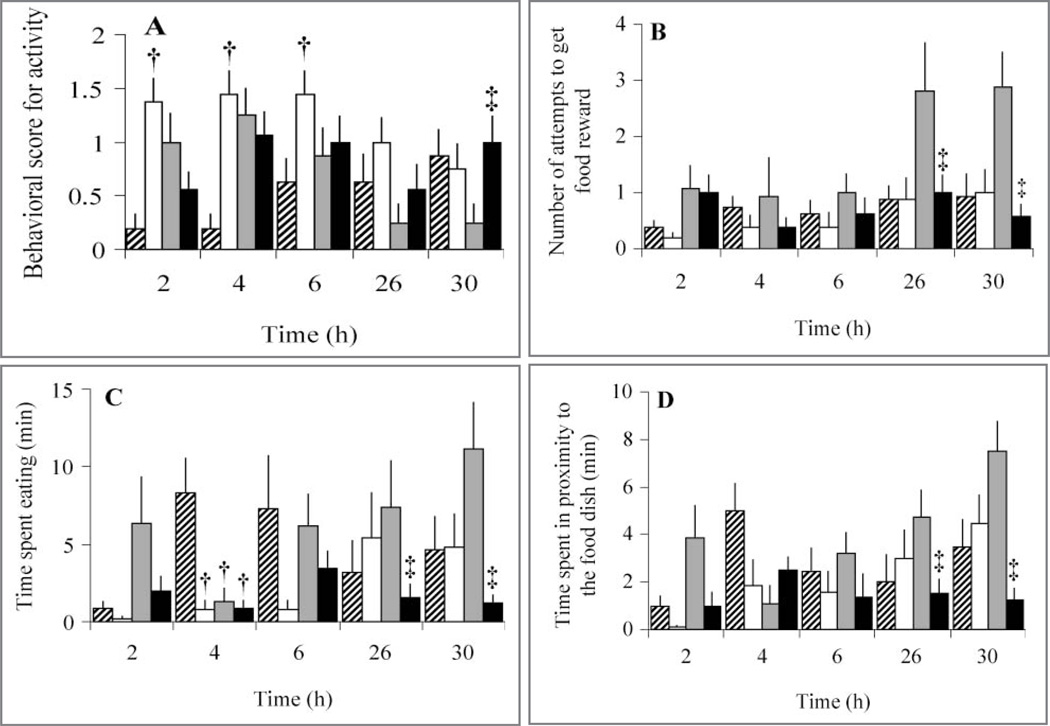
Figure 3.
Mean ± SD behavioral scores for activity (ie, moving about the cage; A), number of attempts to get a food reward (B), number of minutes spent eating (C), and number of minutes spent in the proximity of the food dish (D) during a 15-minute observation period in 8 conures after sham injection or injection of MSU into 1 intertarsal joint (time 0) and subsequent administration of LEBT or the control treatment. †Within a time point, value differs significantly (P ≤ 0.05) from the value for the sham injection followed by the control treatment. ‡Within a time point, value differs significantly (P ≤ 0.05) from the value for the MSU injection followed by the control treatment See Figures 1 and 2 for remainder of key.

