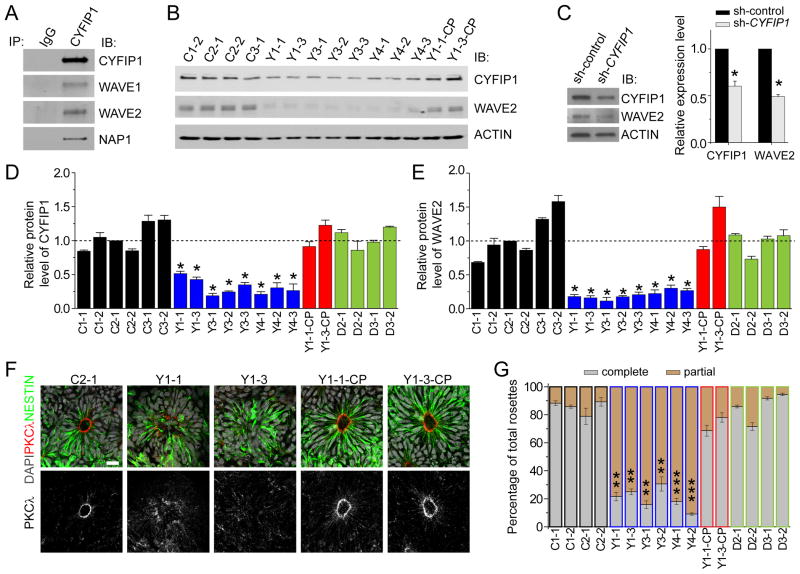
Figure 2. Destabilization of the WAVE complex and polarity defects of hNPCs due to CYFIP1 deficiency.
(A) CYFIP1 is a component of WAVE complex in human pNPCs. Shown are sample Western blot images of co-IP analysis of pNPCs using anti-CYFIP1 antibodies.
(B) Reduced CYFIP1 and WAVE2 protein levels in pNPCs carrying 15q11.2del. Lentiviruses were used to establish two CYFIP1 complementation lines (Y1-1-CP and Y1-3-CP).
(C) Decreased WAVE2 protein levels after CYFIP1 knockdown by lentivirus-mediated shRNA expression in normal pNPCs for 48 hrs.
(D–E) Quantification of protein levels of CYFIP1 and WAVE2 among different pNPCs. All data were normalized to ACTIN levels for loading control and then normalized to CYFIP1 (D) or WAVE2 (E) in C2-1 pNPCs for comparison. Values represent mean ± SEM (n = 3–5 cultures; *p < 0.05; Student’s t-test).
(F–G) Defect in adherens junction and apical polarity of hNPCs carrying 15q11.2del and its rescue by CYFIP1 complementation. Shown on the left are sample confocal images of immunostaining of atypical PKCλ for neural rosettes differentiated from iPSCs using the embryoid body method. Scale bar, 20 μm. Shown on the right are quantifications of neural rosettes similar as in Figure 1E. Values represent mean ± SEM (n = 5 cultures; ***p < 0.001; **p < 0.01; Student’s t-test).
See also Figure S2 and Tables S1, S3.

