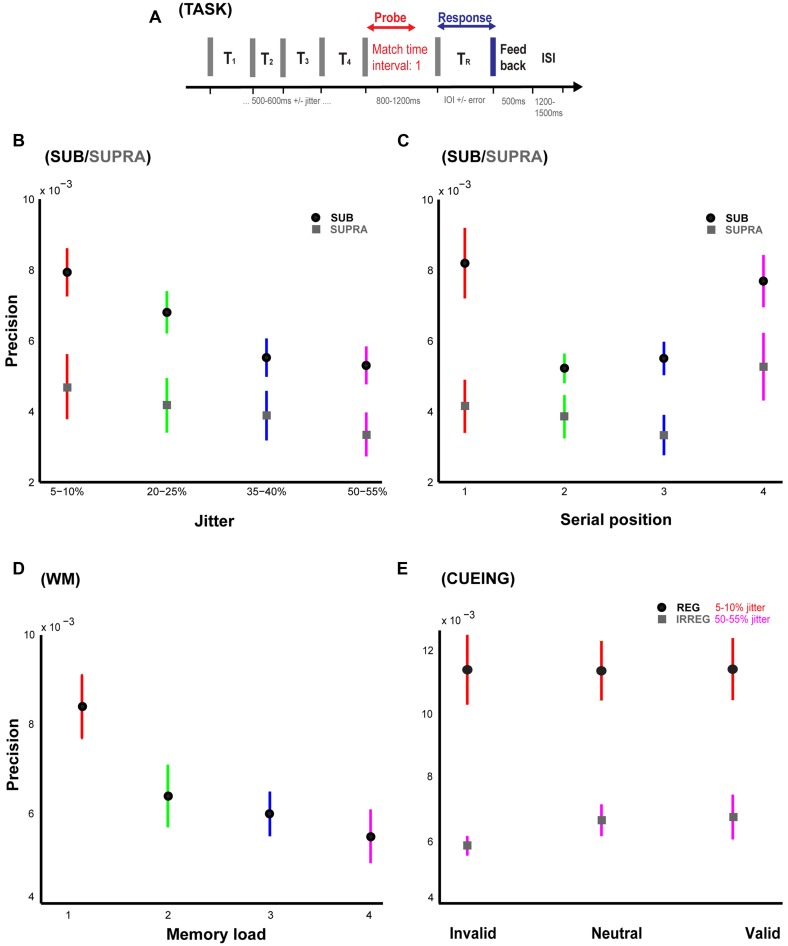
FIGURE 1.
Temporal memory paradigm and behavioral results. (A) Stimulus and task. Listeners are presented a sequence of time intervals (four intervals in Experiments 1, 2, 4A and 4B; and 1, 2, 3, or 4 intervals in Experiment 3) separated by clicks. A visual message is used to display the probe interval to be remembered and reproduced at the offset of the last click in the sequence. After a variable delay period, listeners hear another click which signifies the start of the interval to be reproduced by pressing a button when they think that duration equal to the probed interval has elapsed. Feedback or the difference between the duration of the reproduced and the probed interval is presented after each trial. (B) Precision vs. temporal regularity in Experiments 1 and 2. Precision or the inverse of standard deviation of the error responses is plotted for the four different levels of temporal jitter [5–10% (red), 20–25% (green), 35–40% (blue), 50–55% (pink)]. Data with the mean indicated by black and gray circles is from Experiments 1 and 2 respectively. (C) Precision vs. serial position in Experiments 1 and 2. Precision is plotted as a function of the serial position of the probed interval which could occur randomly at either the first (red), second (green), third (blue), or the fourth (pink) positions. Data with the mean indicated by black and gray circles is from Experiments 1 and 2 respectively. (D) Precision vs. working memory load in Experiment 3. Precision is plotted as a function of the number of intervals which was the variable of interest in Experiment 3. The intervals were presented at any of the four jitter levels as in Experiments 1 and 2. (E) Precision vs. cue in Experiments 4A and 4B. Precision for invalid, neutral, and valid cues is plotted in blue for a sequence of regular intervals (jitter of 5–10%) and in red for a sequence of irregular intervals (jitter of 50–55%). Error bars represent one SEM.

